 |
| Improved evaluation of open type transformers according to IEC 60599 1.Starting situation |
| The norm for the interpretation of the analysis of dissolved and free gases is aimed at closed transformers. The differences between open and closed transformers are only small, so that uniform criteria apply, whose value ranges were defined without consideration of differences. A remark in Section 6.1 of course admits the influence of the open type construction, which then, according to the norm, affect all criteria. The desirable identification of possible influences of the open type construction requires its quantification. |
2.Quantification of the open type construction |
Many years of experience with TGM resaturation measurements after degassing give a detailed insight into the gas household.
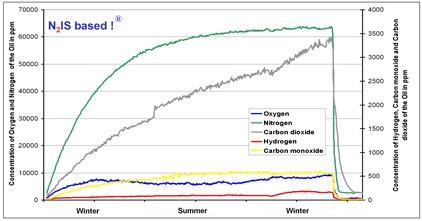
Fig.1 shows the typical concentration slopes of selected gases till nitrogen saturation.
The saturation concentration is nearly  Fig.1 Resaturation measurement on an open type transformer In practice, very different resaturation times are measured. They are dependent on the starting N2 emission rate. The standardisation of the rate for the transformer found to be the least open leads to the transformer openness number (TON), which represents a dimensionless measuring number for the quantification of the open type construction. It is individual and fundamental both for the transport of the atmospheric gases into the tank and for transport of the fault gases into the conservator. For the investigated transformers, the TONs vary from 1 (little open) to 9.2 (very open). In comparison to this, the TON for transformers with a tight air bag is nearly 0.01. Transformer openness number allows the gas consumption or gas emission rates from stationary gas concentration levels to be determined. |
3.Oxygen consumption (OCR) |
| Fig.1 also shows the behaviour of oxygen. The concentration of the chemically active oxygen shows, in difference to nitrogen,
dependencies on the aging state of the insulating system,
which can lead to a significant decrease to less than the saturation concentration (nearly 32,000 ppm).
Load/temperature changes are visible through reversible concentration changes (e.g. summer/winter) influences.
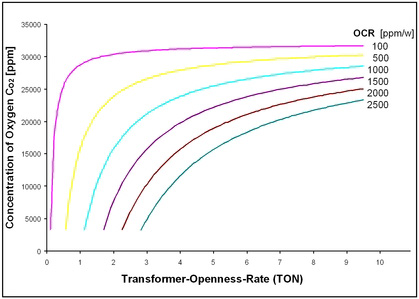
The oxygen decrease is checked in the norm with the help of the quotient O2/N2 < 0.3 (identical < 20,000 ppm O2 as an orientation value) and evaluated (accelerated oxidation reaction). This reflects the balance between oxygen entry and consumption, the latter quantifies the oxidation reactions. The oxygen entry can be determined from the exponential function for nitrogen with the help of the difference between calculated saturation concentration and measured concentration of oxygen (cO2). Fig.2 shows the curves for the oxygen consumption (ppm O2/week) determined OCR values for the investigated calculated on this basis as a function of TON and CO2.  Fig.2 Oxygen consumption in open transformers The transformers are between 3 ppm O2/w (new start) and 2860 ppm O2/w (stressed industry transformer). The risk of raised OCR values (> 500 – 1000 ppm O2/w) begins at cO2 < 28,000 ppm. In this case, it is recommended to make an accurate determination with the known TON. For open type transformers, instead of an orientation value for the oxygen concentration, the oxygen consumption is used as an individual measure of the aging acceleration for the first time. This can be used for activities of substance conservation. |
4.Gas emission rate (GER) for fault gases of little solubility in oil |
Fig.1 shows the different behaviour of the fault gases. The carbon dioxide, which is well soluble in oil, increases steadily during the monitoring time, in the same way as in a closed transformer,
which would also apply to the hydrocarbons, which are well soluble in oil. However, due to the losses caused by the open type construction,
the fault gases hydrogen and carbon monoxide, which dissolve only little, show stationary levels. So it is not possible to determine the GER through difference measurements according to the norm.
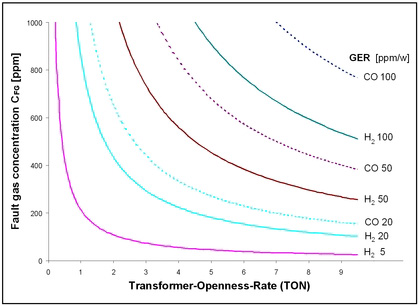
The functional relation between fault gas concentration (cFG) and gas emission rate can be inferred on basis of the transformer openness number.
The curves for hydrogen and carbon monoxide (Fig.3) result from suspect cFG values and post installation hermetic sealing of determined GER values.
The risk of increased GER values (> 5 ppm H2/w or > 50 ppm CO/w) begins with cH2 > 40 ppm or cCO > 400 ppm.
In this case, the accurate determination with the known TON is recommended.
 Fig.3 Gas emission rate of small oil soluble fault gases Practical examples for quotients of fault gases with good oil solubility and little oil solubility (C2H2/H2, CO2/CO) show suitable diagnostic results on the basis of GER values. Concentration quotients can be too high up to factor 10. The same has to be considered for each diagnostic scheme in which is hydrogen involved. Concentrations of fault gases with little solubility in oil are not suitable for diagnoses; however the gas emission rates which show the presence of the fault and allow the determination of the fault type, are. |